There are many tools available to the SEO industry these days, but one tool I always come back to is Google Search Console (GSC). Its simplistic layout makes for an easy user experience and provides valuable resources to improving a website’s SEO for both novice and experienced SEOs. The goal of today’s blog post is to break down some of the most useful features within Search Console so you can begin improving your visibility on the web.
If you are completely unfamiliar with Search Console, there are plenty of resources on the web to assist you in setting up your Google Search Console account, so I am going to jump right into the program’s features.
Google Search Console is a wonderful tool to look at your website’s performance from a high-level as well as communicating pages you want Google to index, finding 404 and 301 redirect errors on your site, and a number of other features that we will get into later in this blog post. The first section we are going to take a look at is “Performance”.
Performance Data
The first tab in Google Search Console to familiarize yourself with is the “Performance” section. Here, you will find information like the total number of clicks and impressions your site is receiving as well as search phrases driving traffic to your site, Click Through Rate (CTR), keyword ranking positions, country of origin, and the device types your users are using to view your website.
When you first open the Performance dashboard you’ll want to select the date range in which you’d like to see data for. Google generally auto populates data from the past 3 months but you can change this to any date range you’d like. You can also compare data from two different time periods which can be great for understanding your website’s performance year over year.
The Performance Graph

The graph depicted at the top of the Performance tab will help you visualize your site’s overall performance using Clicks and Impressions. (You can check out our Comprehensive List of SEO Terms if you are unfamiliar with clicks, impressions, and other terms used throughout this post.) The graph is great for quickly understanding how changes you made affected your site’s performance. For example, if you updated the meta information on your site last week hoping to target specific search phrases, you can easily look at your performance graph to see if it caused any spikes in traffic. Or on the contrary, the graph can help you quickly spot a big dip in traffic, potentially uncovering an underlying issue with your site.
Tip: If you Click on the highlighted boxes above the graph labeled “Total Clicks”, “Total Impressions”, etc. you can hide/show what you want displayed in the graph.
The Lower Performance Dashboard
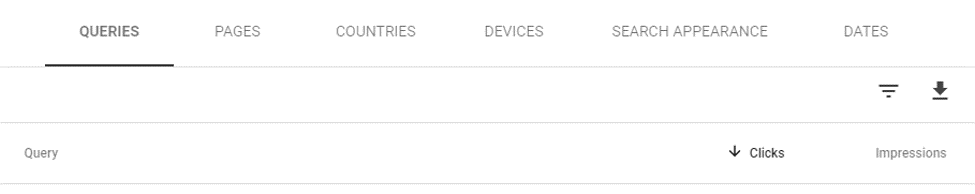
Queries
Within the “Queries” section you will find data on search phrase performance. Your site’s search terms are organized using 2 metrics: Clicks and Impressions. If you’d like to rearrange how your data is shown you can click on “Clicks” or “Impressions” located on the right side of the column.
Knowing what search terms are driving traffic to your site is an essential part of SEO and can help you make informed decisions about your website.
Let’s say you are a picture frame builder who only uses wood, but you keep receiving requests from customers to build metal frames. If you open Search Console and go to your Queries dashboard and notice your top performing search phrase is “metal picture frame builder near me”, you can better understand why you keep receiving irrelevant requests on your website. The solution here would be to build out content on your site using phrases like “wood picture frame” and letting Google know that you don’t build using metal.
Pages
The Pages section is almost identical to the Queries section. This section is here to let you know what pages on your site are driving the most and least amount of traffic.
I find this tab especially useful because you can determine what pages are ranking well and driving the most traffic to your site and what pages need optimizing. Once you review your page performance in GSC, open up Google Analytics and take a deeper dive into other SEO metrics such as CTR or conversion rate if you have an ecommerce website to determine why some pages are performing better than others.
Tip: If you click on a specific page or search query within your dashboard, Search Console will change the graph to only show data for your specific selection.
Countries
Select the Countries tab to better understand location information about your website.
If you notice that you are receiving a bunch of traffic from a country you don’t service or sell products to, this might make you consider offering your products or services internationally.
Devices
Google breaks your device traffic down by either Desktop, Mobile, or Tablet.
This is great information to know especially if you do not currently have a mobile responsive website.
Filters for the Performance Dashboard
There are 5 Filters you can apply to the different sections within the Performance tab. These are super helpful when you want to narrow in on a specific keyword, type of user, or page. To activate a filter, select the upside-down triangle symbol located under “Dates”. You will then see the option to select Query, Clicks, Impressions, CTR, or Position. I personally use the “query” and “position” filters most frequently.

I often use the “Query” filter to exclude branded keyword phrases. Excluding these can help you better visualize other non-branded search terms you are and are not ranking for in the search results and maybe spark a few content ideas for your website or blog.
The Position filter will help you determine how your website is ranking in the SERPs. For example, if you want to see what keywords you are ranking for in the top 50 results of Google, Select the Position FilteràChange the dropdown to “Smaller Than”à Input “50”à Click “Done”.
Bonus: You can select more than one filter to view even more targeted data.
URL Inspection

The URL Inspection Tool provides you with various information about a specific page on your website. First, copy and paste a full URL including http(s):// into the “Inspect any URL” Address Bar at the top of Google Search Control. It will take a minute for Google to load the page so just be patient. You will then be provided with some technical information about the URL you submitted. Depending on the age of the page you inspected it will either already be indexed or you will have to select “Request indexing”. Let’s break down the different components within the URL Inspection Tab.
- Coverage: This section will inform you whether Google was able to index and access the URL you submitted. It will let you know if the page is included in your sitemap, if a canonical URL is applied, the last time Google crawled the page, etc.
- Mobile Usability: Here is where you can find whether a URL is mobile friendly or not. If there are errors with the page, Google will list them so you can go in and make necessary changes on your website.
- Sitelinks Searchbox: The sitelink searchbox is a nifty feature some websites utilize within the search results. You’ve likely stumbled upon this while making a Google search, but it is essentially a search box within a specific Google search result so that users can search for something on a specific website without having to visit the website first. A very popular site using this is YouTube.

- Tip: If a page is already showing up as indexed, but you recently made some changes to a page or updated a pages meta information I would recommend “Request Indexing” again for the URL. This is something I have gotten in the habit of doing and it seems to produce positive results and improves the rate at which updates appear in the Search Results.
Coverage
The Coverage Tool gives you detailed information about broken pages and other technical SEO issues on your website. The rule of thumb here is, if there is red showing up in your Coverage tab then you should spend some time cleaning up these errors. Google doesn’t like broken links and neither do your users so these should be attended too!

Sitemap
This page is used for one thing – submitting your website’s sitemap to Google for indexing. Although Google is smart enough to find your sitemap on its own, it is an SEO best practice to still upload your sitemap URL through Google Search Console. My thought is if they didn’t want me to upload it, they wouldn’t have included the feature in GSC. There are a number of different URL structures used for sitemaps but for those using a WordPress website and have the Yoast plugin installed you can find your sitemap at yourwebsitesdomain.com/sitemap_index.xml. Other common variations are /sitemap.xml and /xmlsitemap.php.
After submitting your sitemap, take a look at your Search Console data after about a week or two and you’ll likely notice that your impression and click data has moved upward.
The SEO Mindset
To end this week’s blog post, I wanted to stress the importance of knowing how to use and interpret data correctly in order to solve a problem or question. A common issue with SEO tools and data collection is that it is easy to open a program and spend a bunch of time looking through its data and visualizations, but not having the know-how to interpret its information to make educated improvements. You have to learn its features and what the data means in order for a tool like Google Search Console to assist you in your Search Engine Optimization. Think about a time you bought a new piece of technology, a tool from Home Depot or an expensive instrument. Did you just pick it up and look at its fancy features and design or did you actually learn how to put it to use to fix something or write a song? One of the most rewarding parts of SEO is seeing visualizations of your search rankings or monthly revenue increases, but it takes work and time spent understanding your data to ultimately improve results. When you open up Search Console, I challenge you to have a question prepared so you can optimize your time and become an efficient SEO.
Feel free to leave a comment below or Contact Us directly if you need assistance setting up and using Google Search Console for your website.
“”